Aeris Chart
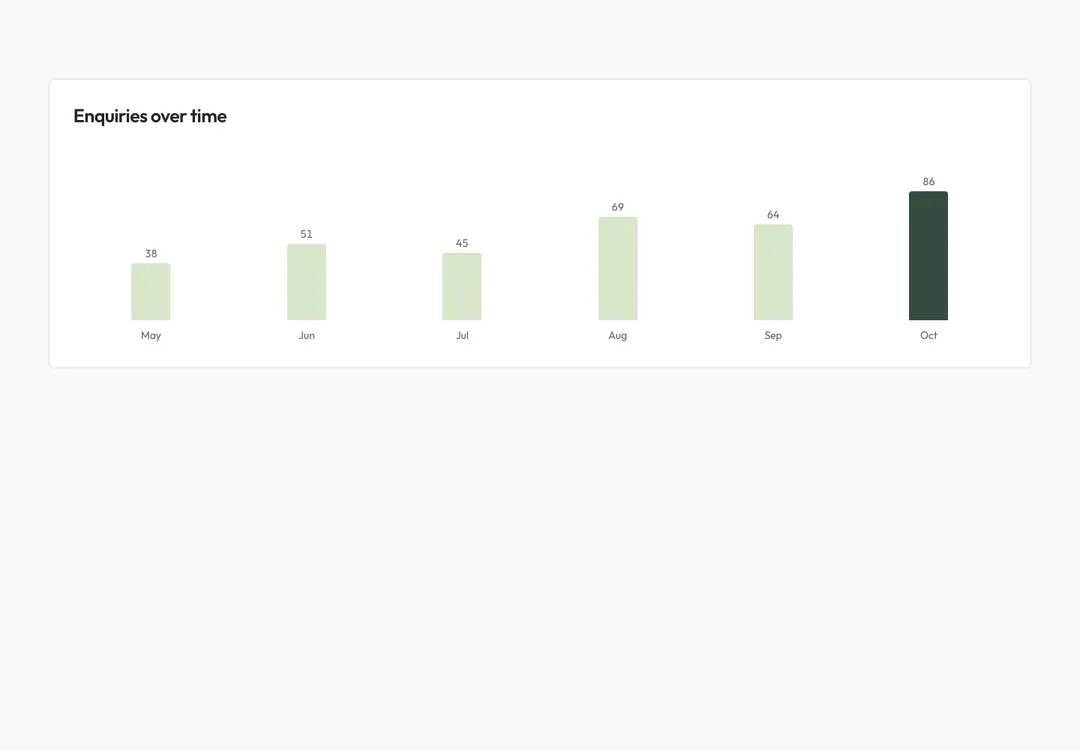
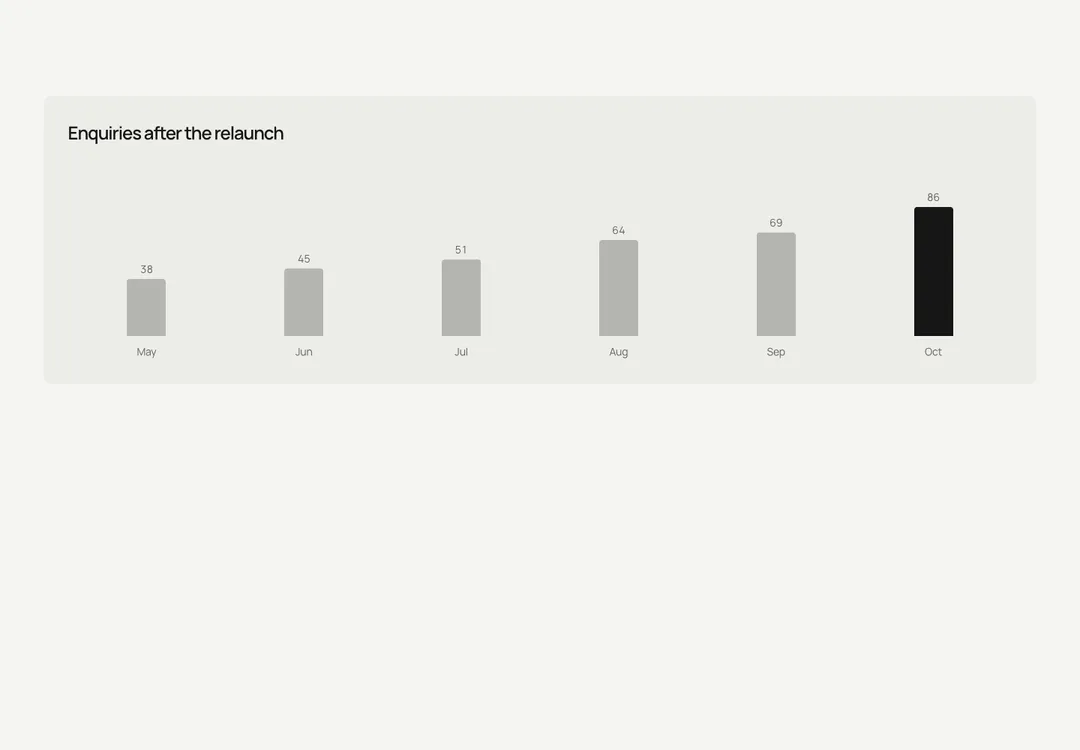
Plots lines, areas or bars in SVG with HTML labels, so text never stretches as the width changes.
Glass MeridianMotion
Plots lines, areas or bars in SVG with HTML labels, so text never stretches as the width changes.
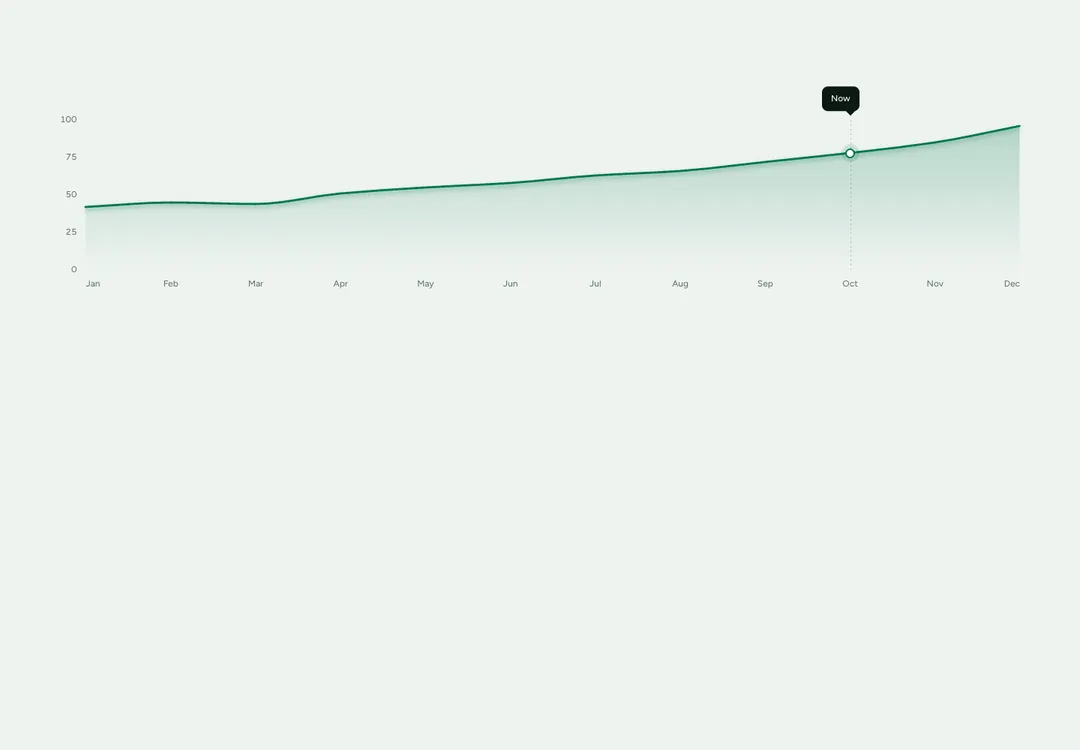
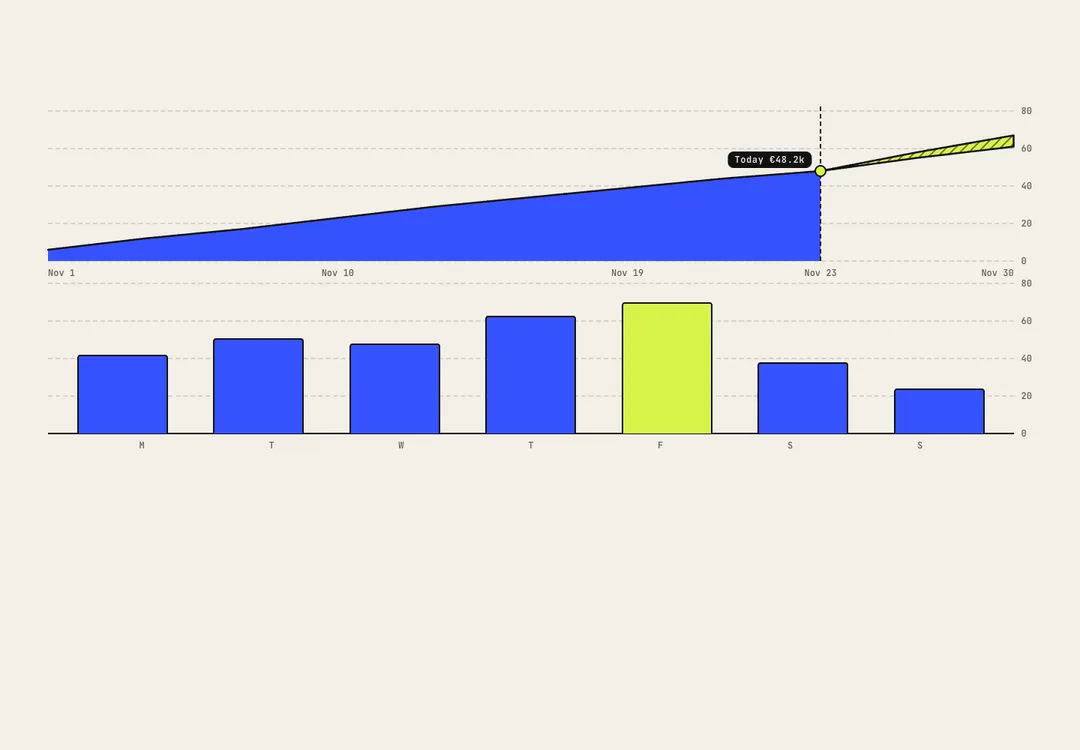
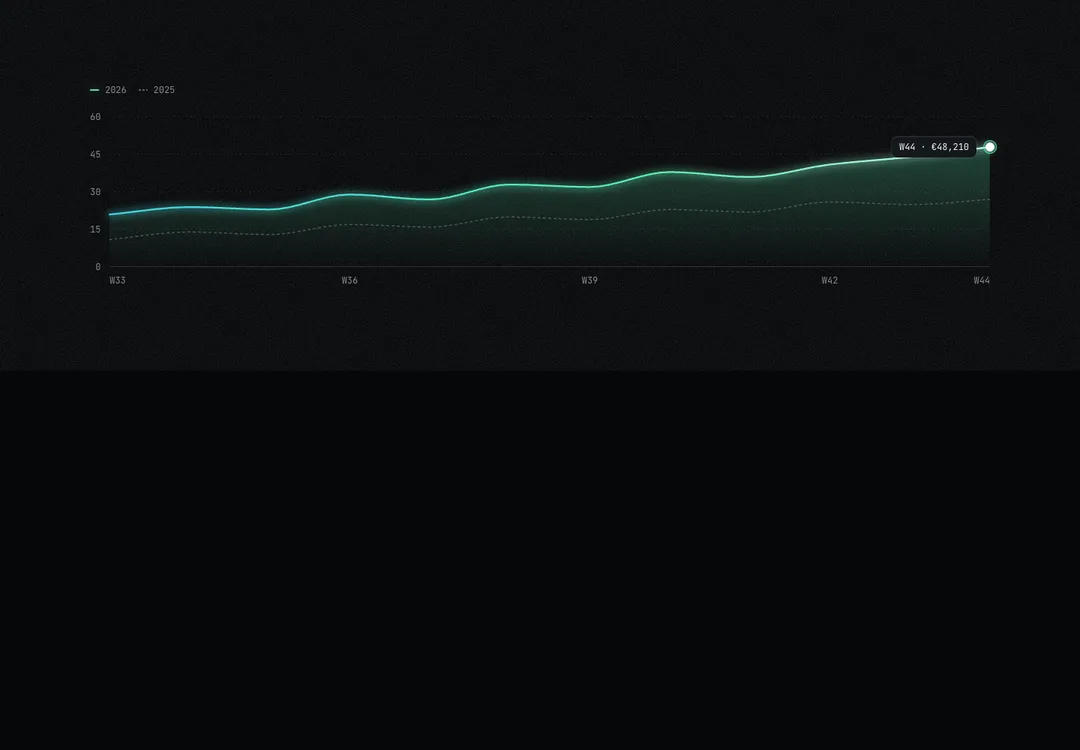
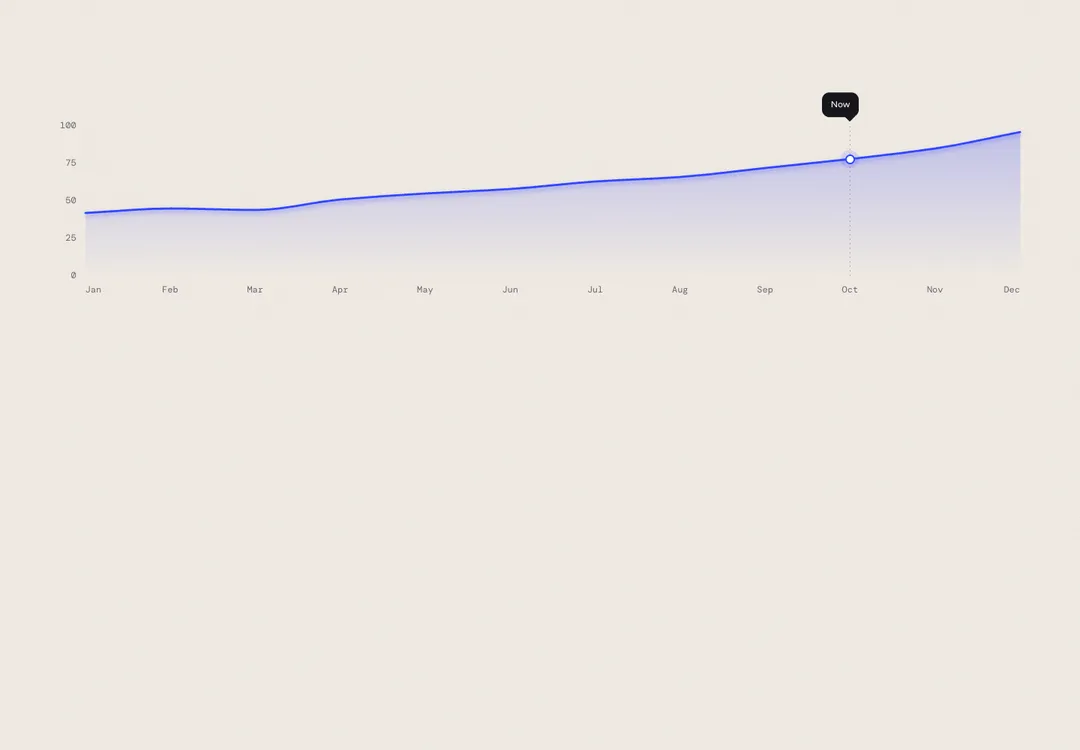
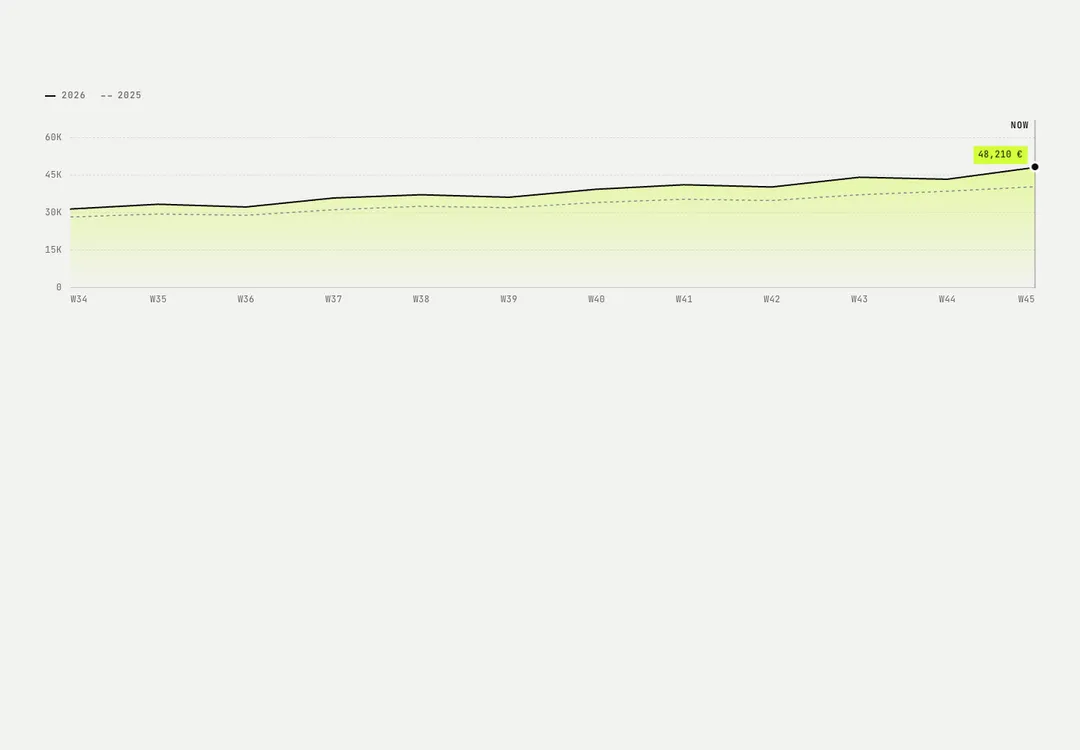
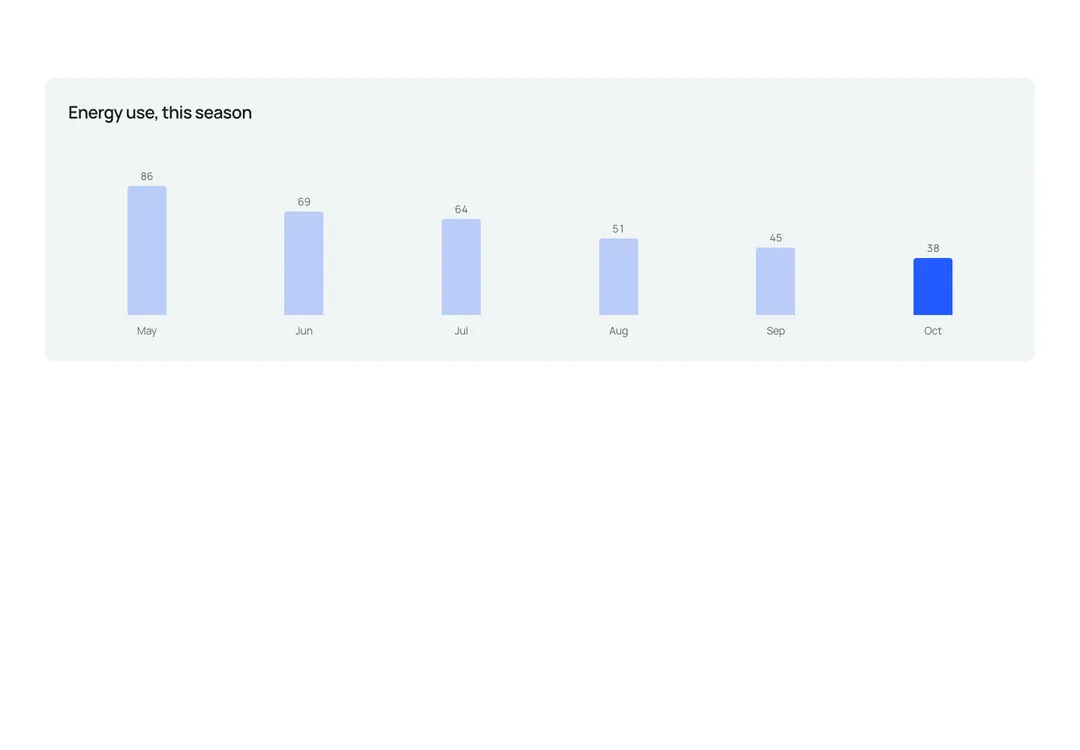
The meridian with axes: a line, area or bar chart in SVG with HTML labels, nodes and pin, so nothing stretches with the fluid width. A tone 1 series is the line itself, with its halo; a dashed tone 1 series is the forecast, in round dots; other tones are thinner comparison lines (dashed for a plan or last year). band is a soft range behind the line. nodes puts nodes on the first series, and marker is the current node (larger, with a second ring) with its label as a data pin beside it. Bars are solid columns; a dashed bar series is hatched (a forecast). Axis labels are mono data captions. The plot draws open from the left over 2.4 s, the nodes light up in order and the pin arrives at half the draw. It counts as the view's one drawn line. Always pass label, and summary when the trend matters.
It is part of Glass Meridian: daylight sky, frosted glass, one blue line. The style’s 92 pieces share one set of tokens, type and motion, in a light and a dark theme, so whatever you take from it fits together.
To put it in your project, copy the prompt into Claude Code, OpenAI Codex or Cursor, or add it by hand. The documentation walks through both.
Plots lines, areas or bars in SVG with HTML labels, so text never stretches as the width changes.
Plots lines, areas or bars in SVG with HTML labels, so text never stretches as the width changes.
Plots lines, areas or bars in SVG with HTML labels, so text never stretches as the width changes.
Plots lines, areas or bars in SVG with HTML labels, so text never stretches as the width changes.
Plots lines, areas or bars in SVG with HTML labels, so text never stretches as the width changes.
Plots lines, areas or bars in SVG with HTML labels, so text never stretches as the width changes.
Plots lines, areas or bars in SVG with HTML labels, so text never stretches as the width changes.
Plots lines, areas or bars in SVG with HTML labels, so text never stretches as the width changes.