Glass Meridian Sparkline
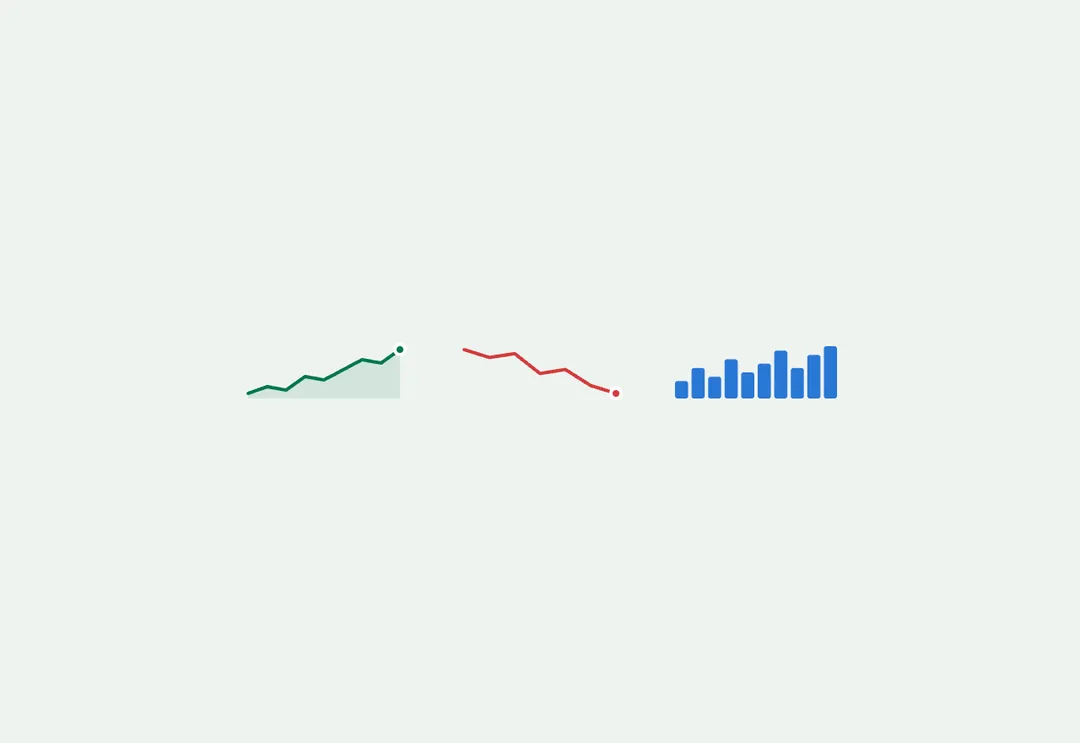
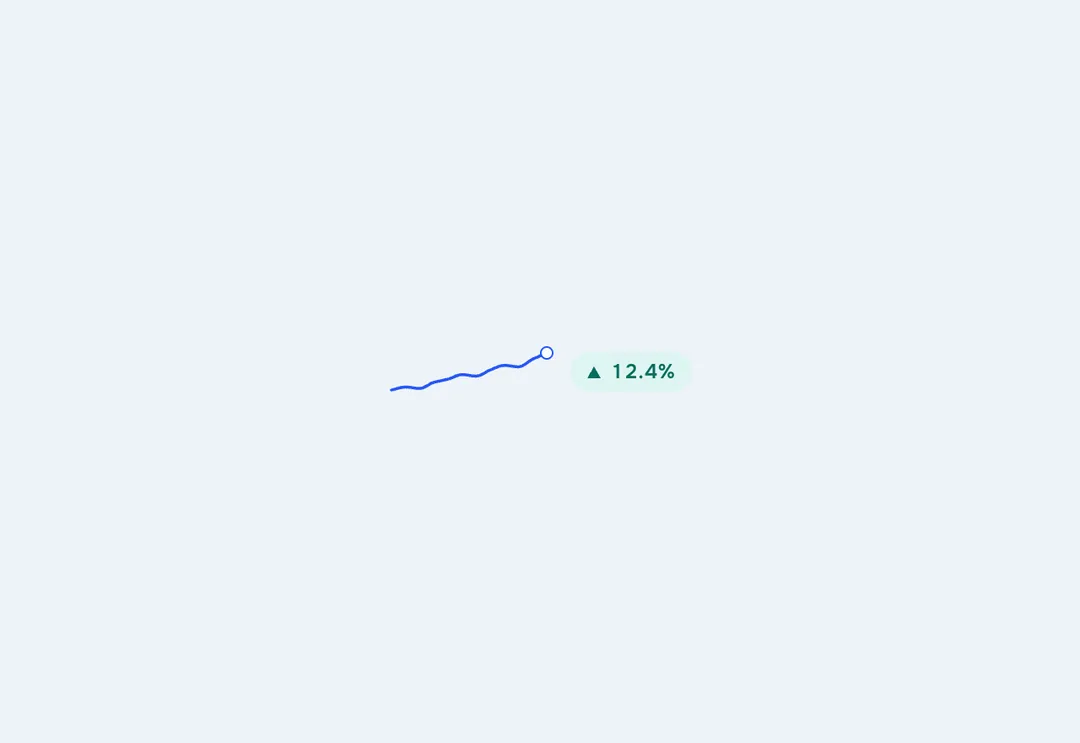
A word-sized chart with no axes, for the trend beside a figure.
11 React pieces for showing data in an admin: KPI cards with sparklines, donut, funnel and heatmap charts, a ranked bar list, a data table, a filter bar, a detail list and an activity feed. Preview each live.
A word-sized chart with no axes, for the trend beside a figure.
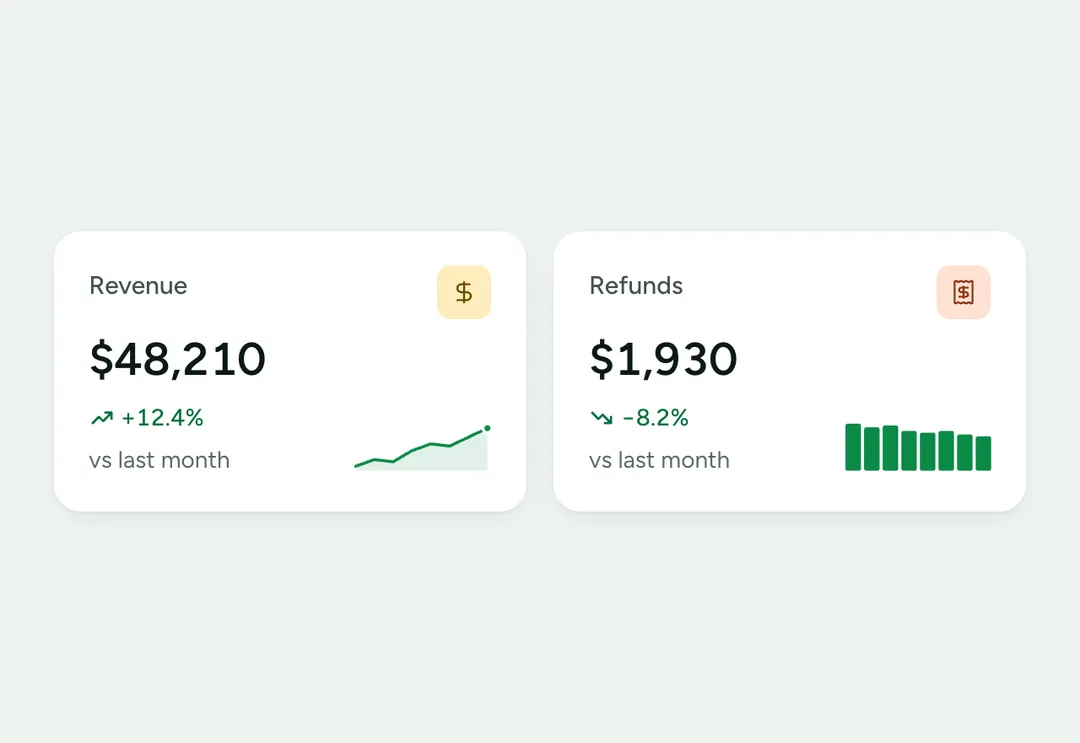
One KPI on a card: the figure, its change against the last period, an icon chip and a sparkline.
A word-sized chart with no axes, for the trend beside a figure.
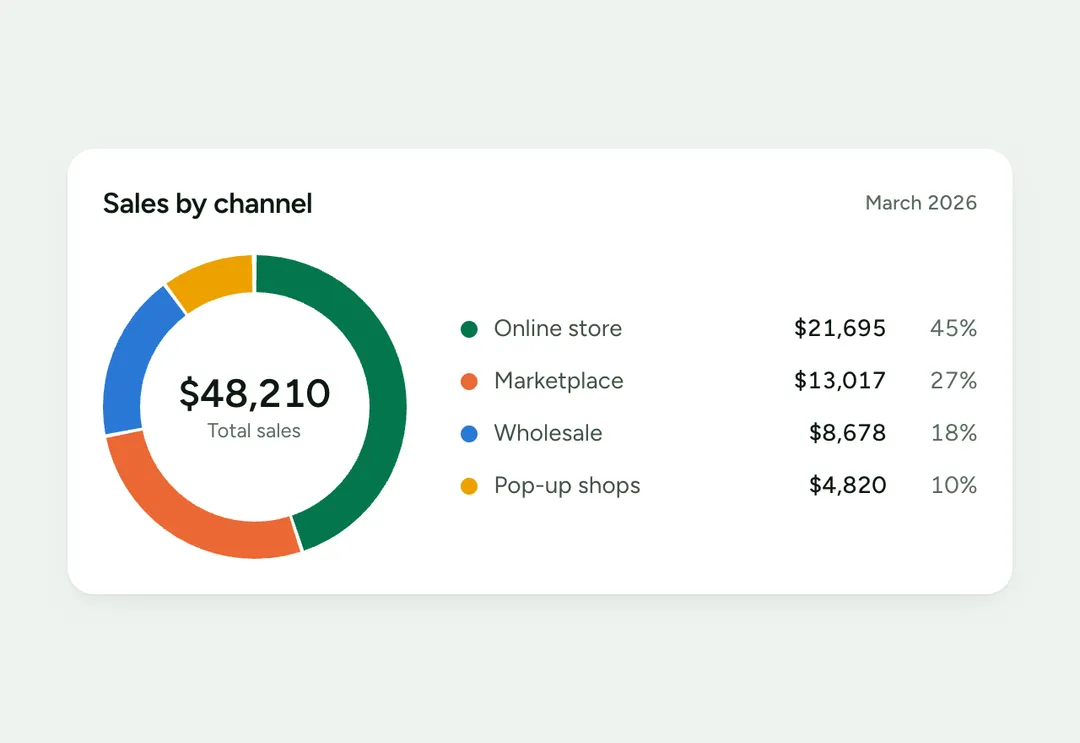
Parts of a whole as a ring with a legend, or a half-ring gauge for one share of a goal.
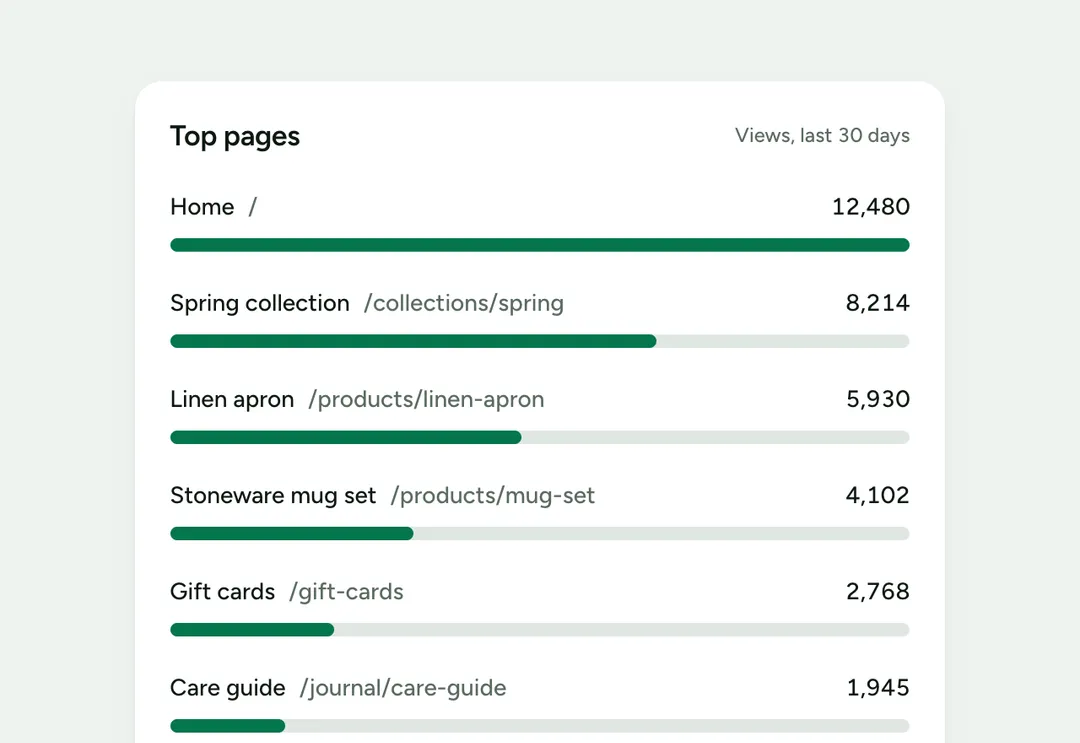
A ranked list in which each row has a label, a thin bar and its value.
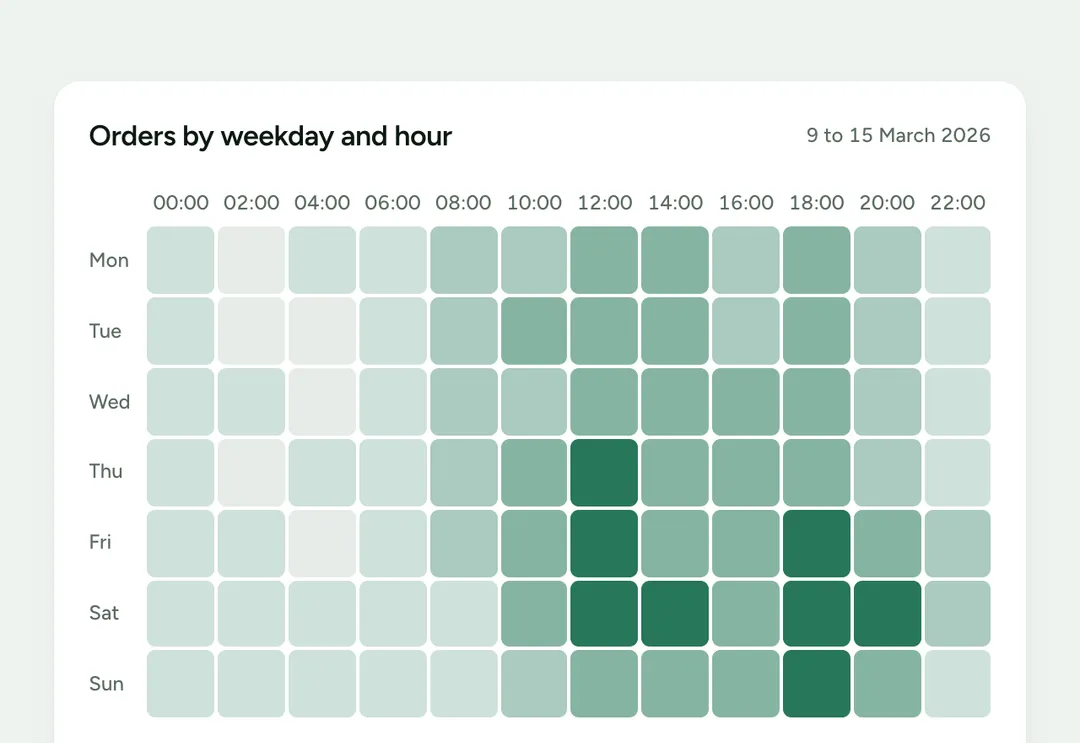
A grid of cells shaded in one hue for two axes, such as weekday by hour, built as a real table.
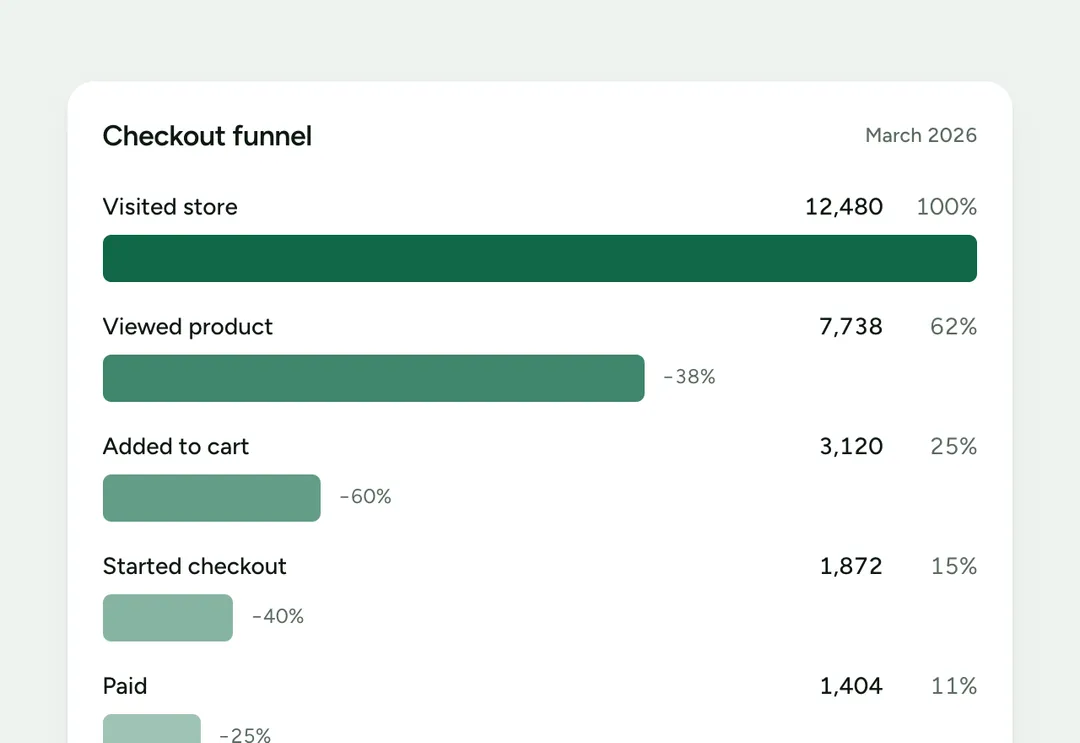
Steps of a conversion with each step's value, its share of the first step and the drop between steps.
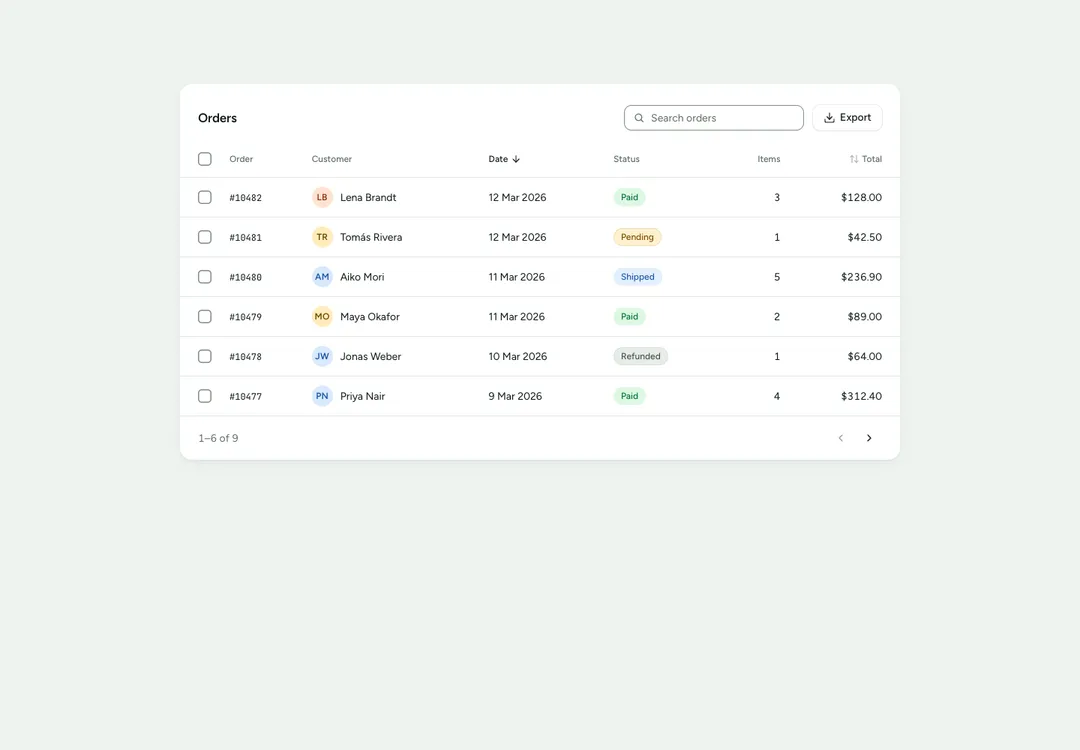
A table on a card with search, sortable columns, row selection, bulk actions and paging.
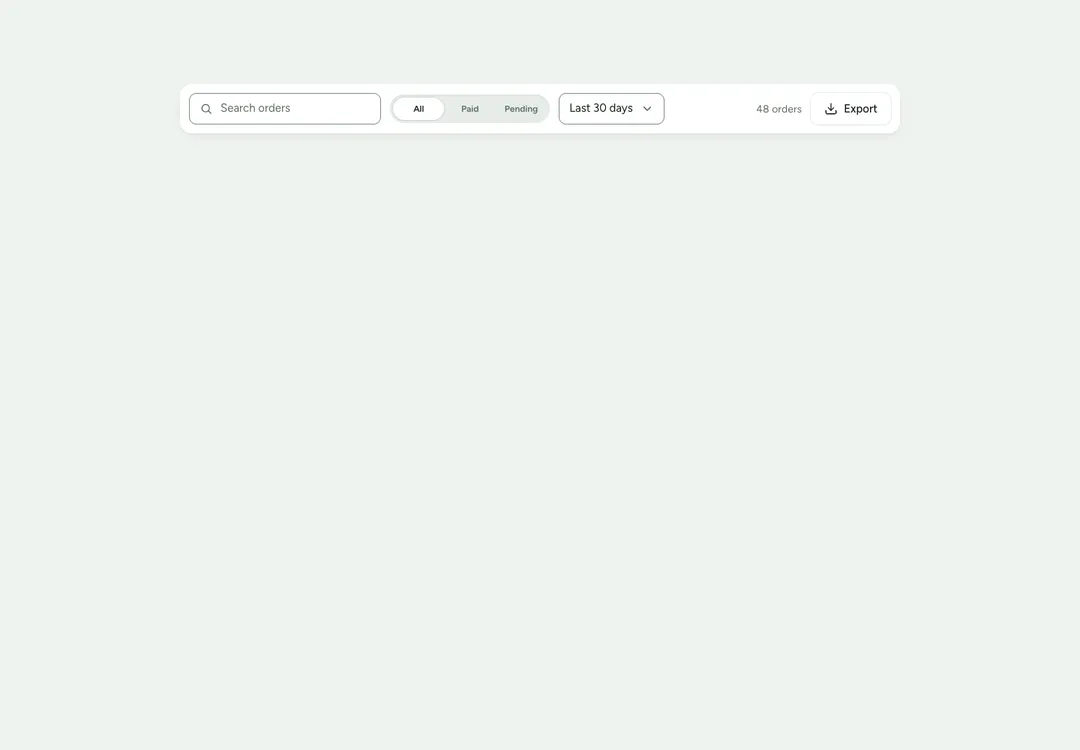
The row above a list: search, filter controls, a result count and actions; wraps on phones.
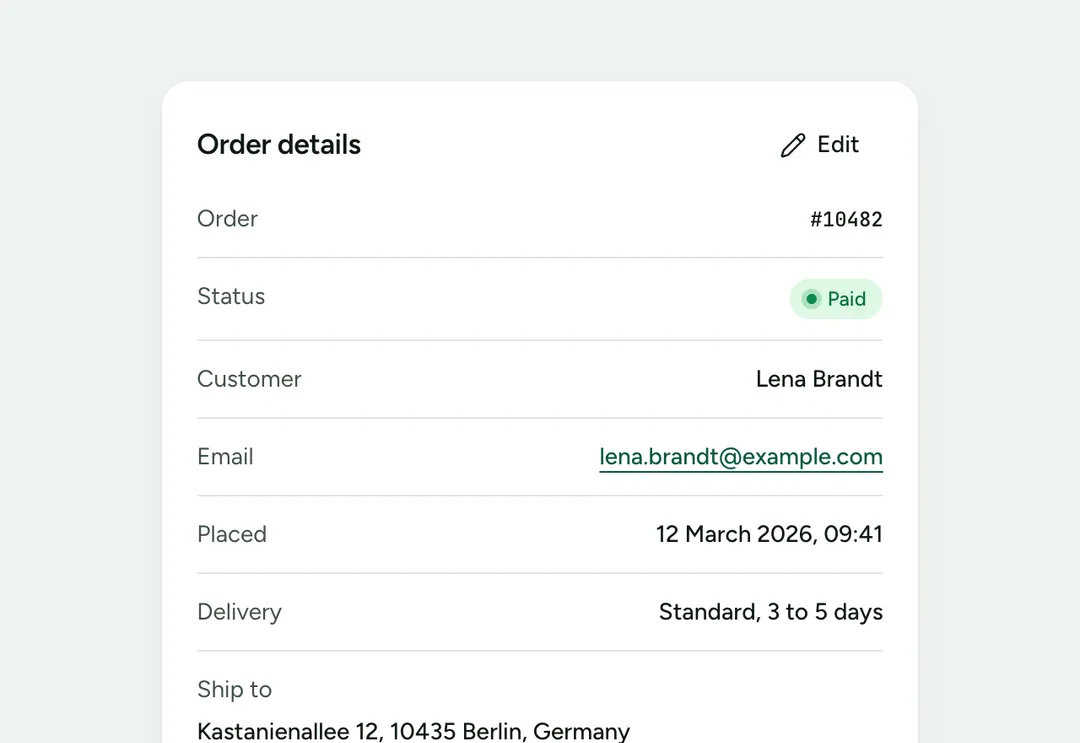
Label and value pairs as rows, a grid or stacked, for summaries and profiles.
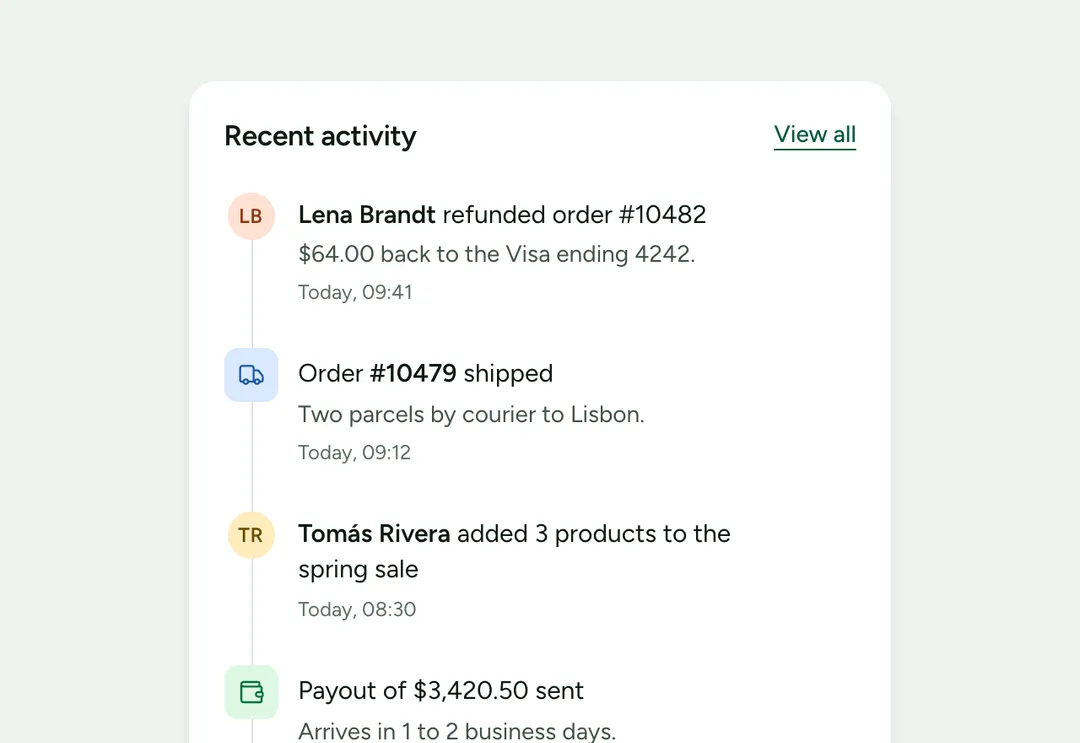
What happened, in order, as a feed of rows or a timeline along a rail.
The KPI card shows one figure with its change against the last period, colored by whether the change is good, and a sparkline of the trend. The charts are drawn in SVG and CSS with no chart library: a donut for parts of a whole (or a half-ring gauge), a ranked bar list, a heatmap in one hue for two axes, and a funnel for the steps of a conversion. Each has an accessible name and gives its numbers as text as well.
The data table sits on one card with a search field, sortable columns, row selection with bulk actions, and paging; wide tables scroll inside the card. The filter bar is the row of controls above a list, the detail list sets label and value pairs for a summary, and the activity feed lists what happened as rows or along a timeline. Series colors come in a fixed order and text in a chart is never colored, so charts read the same in light and dark.
A free account takes 3 new pieces a day: the code, the styles and the install prompt. Pro and Team remove the limit.