Bavaria Chart
Plots lines, areas or bars in SVG with HTML labels, so text never stretches as the width changes.
AerisMotion
Plots lines, areas or bars in SVG with HTML labels, so text never stretches as the width changes.
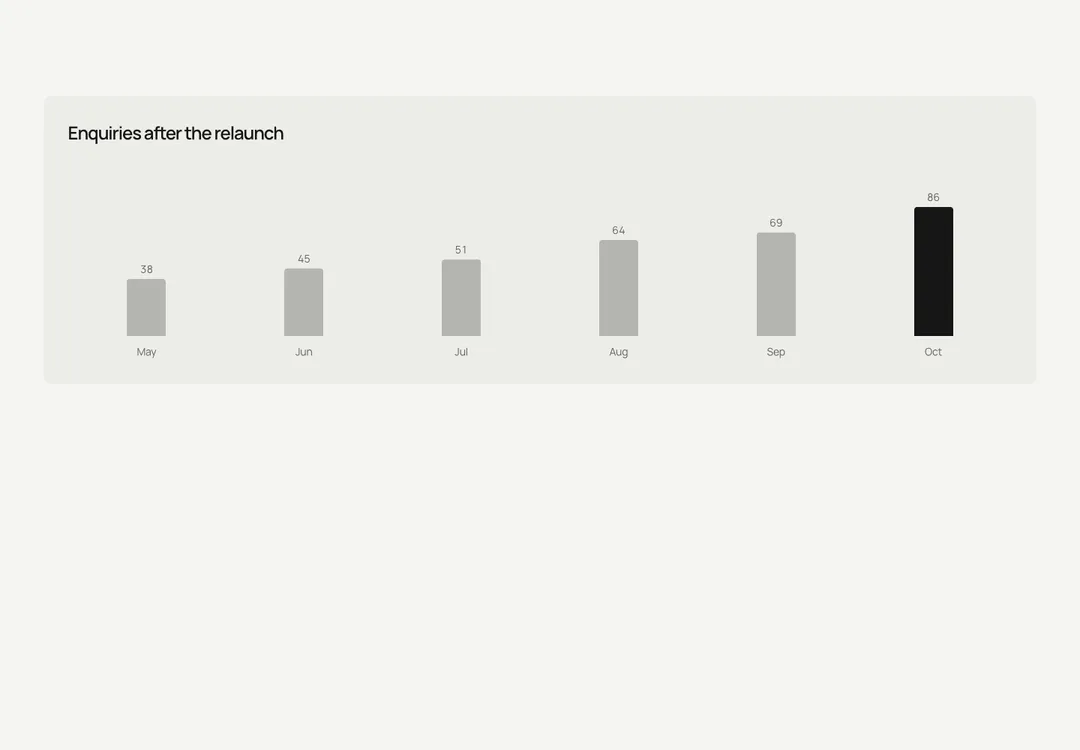
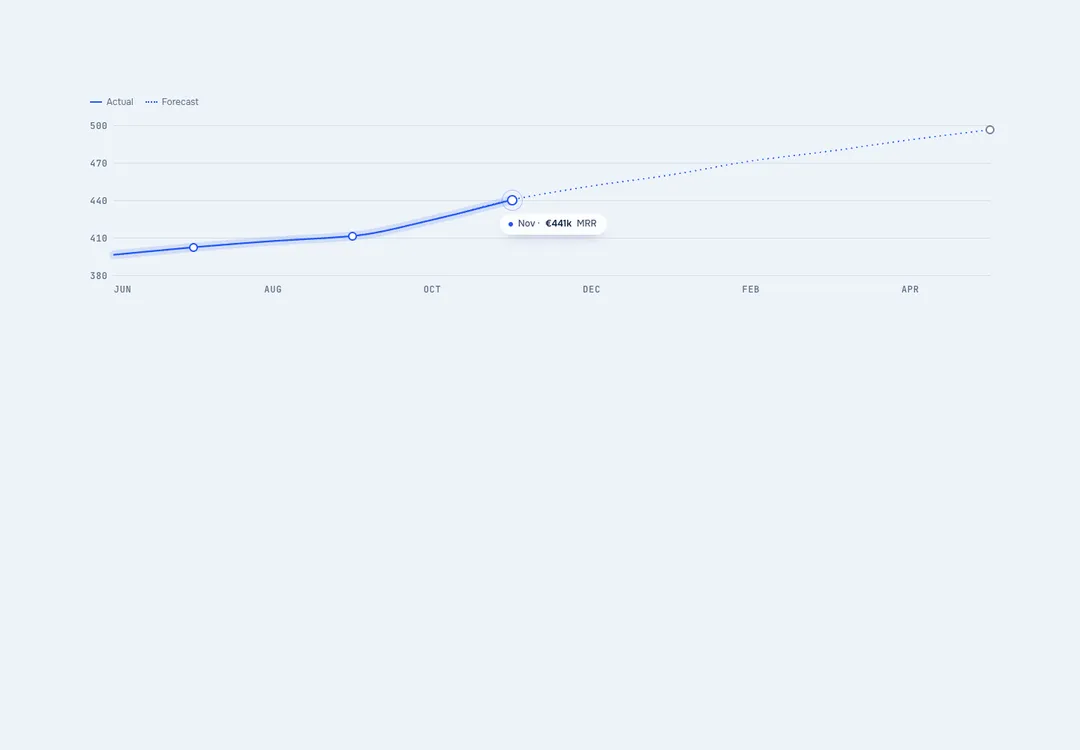
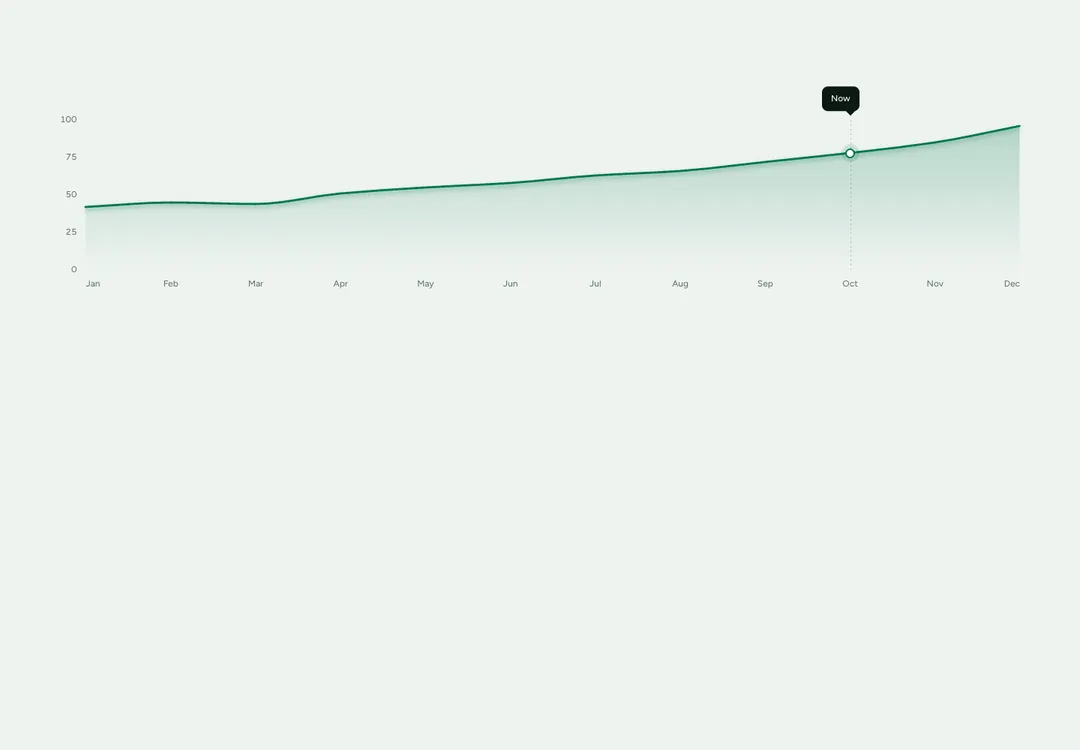
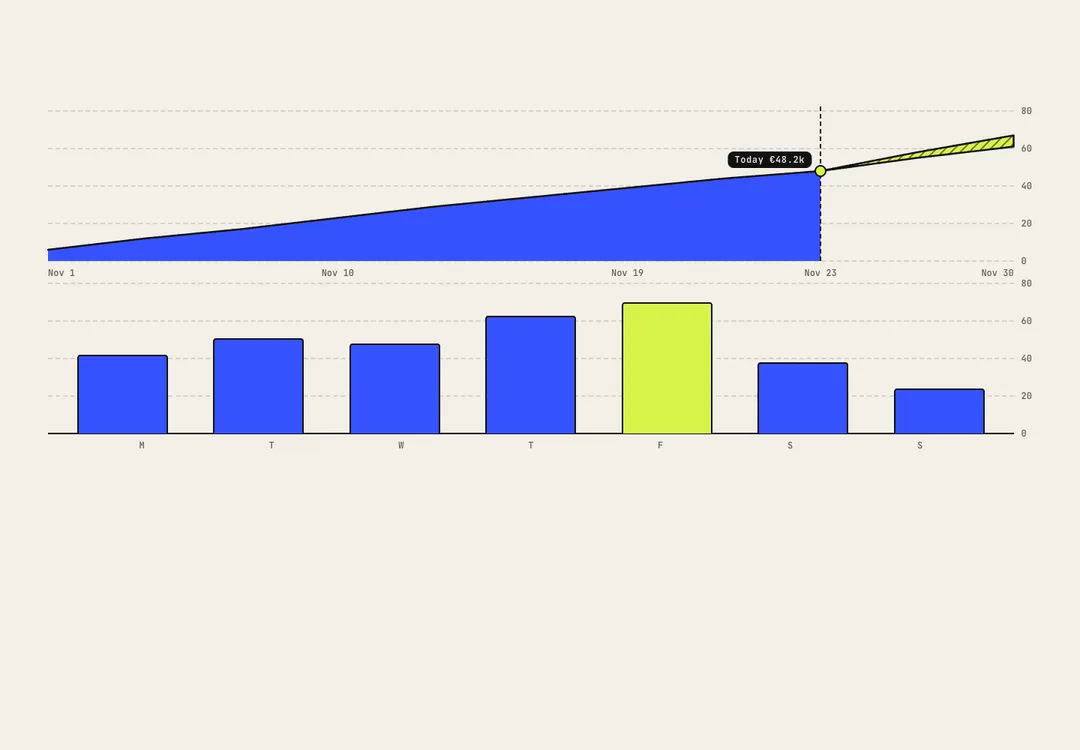
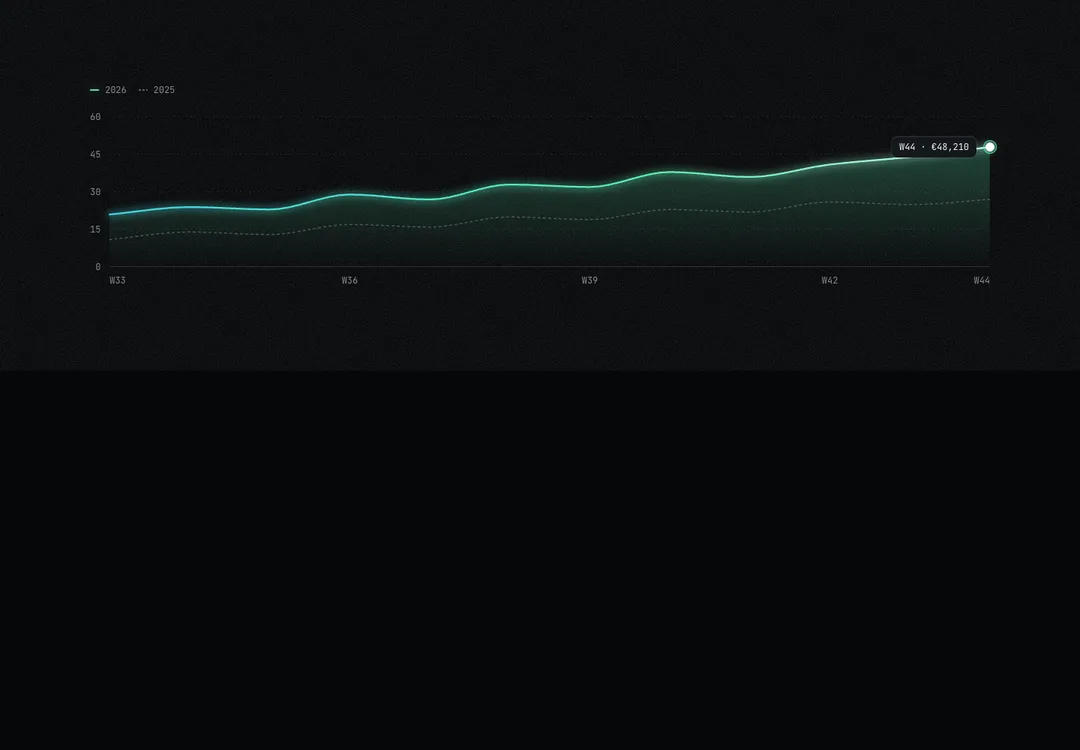
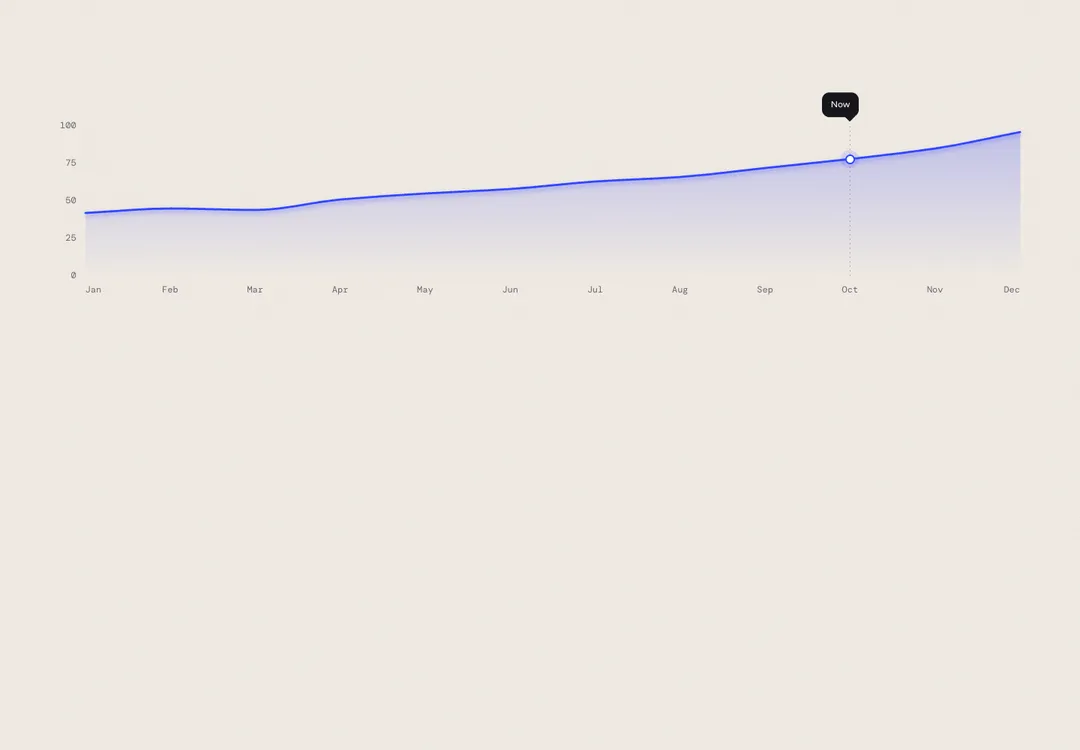
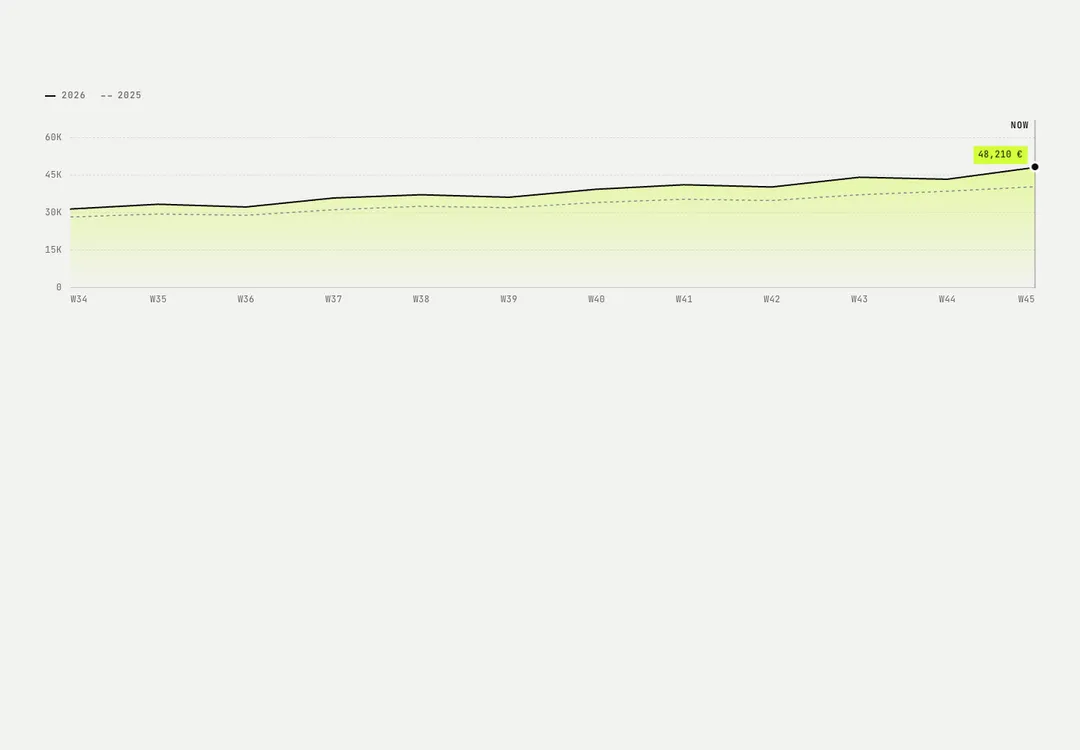
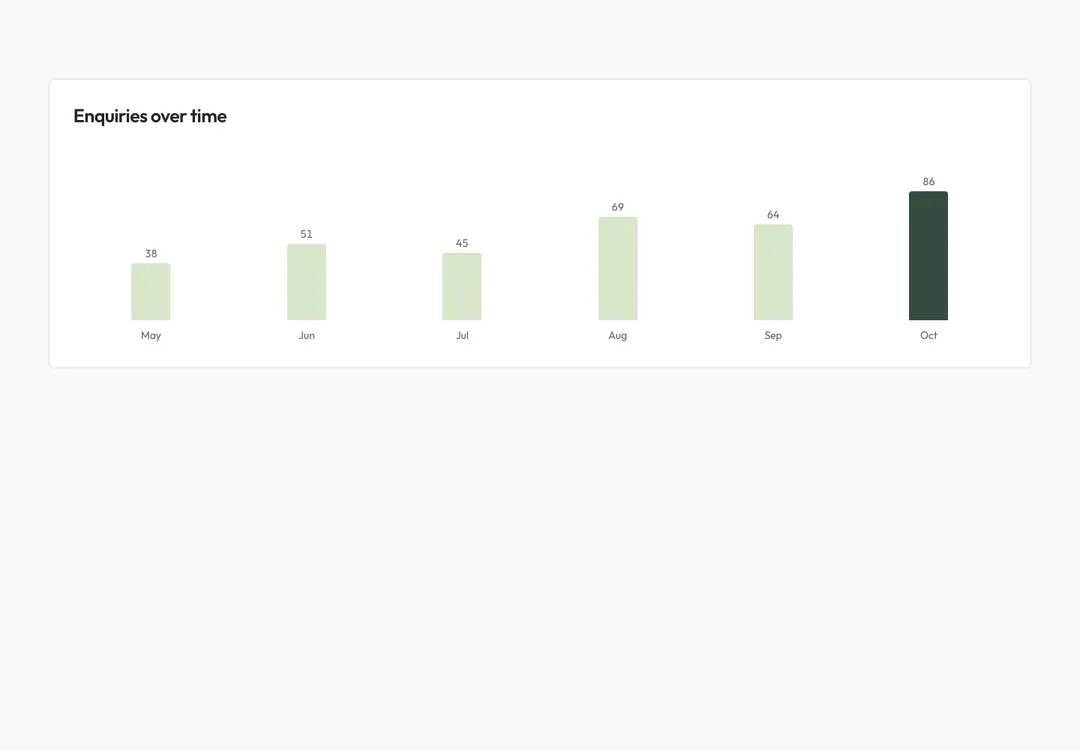
A line, area or bar chart in SVG with HTML labels, so text never stretches with the fluid width. Series 1 is the accent line (its light companion in dark mode) over a faint wash; later series follow in teal, terracotta, violet and grey; dashed series are comparisons; band is a forecast range as a pale wash. A lone bar series is drawn in a pale share of the accent with round-topped bars and its marker bar in the accent itself, as a report shows its latest month; values prints each figure above its bar. The grid is hairlines and the labels small, muted and sentence case. It draws open from the left between 200 ms and 1.2 s, then the marker's value tag fades in. Always pass label, and summary when the trend matters.
It is part of Aeris: white pages, soft grey cards, one electric blue. The style’s 92 pieces share one set of tokens, type and motion, in a light and a dark theme, so whatever you take from it fits together.
To put it in your project, copy the prompt into Claude Code, OpenAI Codex or Cursor, or add it by hand. The documentation walks through both.
Plots lines, areas or bars in SVG with HTML labels, so text never stretches as the width changes.
Plots lines, areas or bars in SVG with HTML labels, so text never stretches as the width changes.
Plots lines, areas or bars in SVG with HTML labels, so text never stretches as the width changes.
Plots lines, areas or bars in SVG with HTML labels, so text never stretches as the width changes.
Plots lines, areas or bars in SVG with HTML labels, so text never stretches as the width changes.
Plots lines, areas or bars in SVG with HTML labels, so text never stretches as the width changes.
Plots lines, areas or bars in SVG with HTML labels, so text never stretches as the width changes.
Plots lines, areas or bars in SVG with HTML labels, so text never stretches as the width changes.